Add varioussoftware.blogspot.com to your favorite online bookmark site:

BlinkList blogmarks del.icio.us digg Fark Furl Ma.gnolia NewsVine OkNotizie Reddit Shadows Simpy Spurl Segnalo TailRank Technorati YahooMyWeb

Saturday, April 28, 2007

DESKTOP JAVA GAMES

Here are some of Java (sun) Games offered;

Pharoah's Solitaire
Pharoah's Solitaire
If you love Solitaire, check out this spin on the classic game.

Vaults of Atlantis Slots
Visit this underwater casino and try your luck


WildSnake Arcade: Invasion Waves
No more bricks, no more breaks


Chess
Chess
Capture the king!


NEW MOBILE GAMES FROM JAVA

For you are looking for games for your mobile, Java (Sun) offered new version of their mobile games list below:

Downtown Texas Hold'em
Enjoy the ultimate wireless poker.


SimCity
SimCity
Design and build the city of your dreams on your mobile phone.


Jewel Quest II
Jewel Quest II
Enjoy hours of puzzle fun in the search for jewels!


3D Constructo Combat
Go constructo crazy!

Inca Quest
Inca Quest
Discover the Incan treasure that you've been searching for!

EA SPORTS Madden 07
EA SPORTS Madden 07
Take the field as your favorite NFL team and players.

24 Agent Down
24 Agent Down
Regain control of CTU headquarters.

Familiars
Familiars
The destiny of creation lies in your hands.

Orcs & Elves
Orcs & Elves
Escape to a place of adventure, mystery and sorcery!

Doom RPG
Doom RPG
Are you ready to battle the cyber demons?

The Sims™ 2

The Sims 2 on mobile features completely unique storylines giving players the ability to customize and take control of their Sims. It offers a Create-A-Sim function, which enables players to create and customize their own Sims from a variety of components. The classic The Sims 2 gameplay allows players to satisfy their Sim's wants, buy objects, develop their Sim's careers and skills, and even develop relationships with other Sims. The intuitive 'one thumb' gameplay combined with an immersive 3D Sims world will let both old and new players enjoy the game of life on their mobile phone.


Available on:
Cingular | Sprint,T-Mobile | Alltel | Boost | Midwest Wireles | Sprint | Nextel | nTelos | US Cellular | Verizon | Virgin Mobile | Western Wireless


Download Shockwave Player

Windows Version Download


File size: 2,737 K
Download Time Estimate : 6 minutes @ 56K modem
Platform : Windows
Version: Shockwave 10.2.0.021
Browser : Netscape or Netscape-compatible and Internet Explorer
Date Posted : 4/23/2007
Language : English, French, German

Installation Instructions

1. Click the "Download Now" button to begin installing Adobe Shockwave Player.

2. When asked, save the Installer to your desktop.

3. When the download is complete, locate the Installer and double-click on it. The Installer will launch and dialog boxes will lead you through the rest of the installation process.

4. When the Adobe Shockwave Player movie begins playing, your installation is successful.


If you have installation questions or need help troubleshooting the Adobe Shockwave Player, see Adobe Support Center.

Find answers about Adobe Shockwave Player privacy, licensing, developing Shockwave content, and more in list of Frequently Asked Questions (FAQ).

Sun Java Software is

What is Java Software?

Java software allows you to run applications called "applets" that are written in the Java programming language. These applets allow you to play online games, chat with people around the world, calculate your mortgage interest, and view images in 3D. Corporations also use applets for intranet applications and e-business solutions.


Note: if you want to download a version for a system or browser other than the one you are on now, please use the manual download link below.

> Manual Download

> Help

After you download Java software, visit java.com to find the latest games, software, and music that run on Java technology.

Thursday, April 26, 2007

How to get free traffic to your blog

This is how you can get 100 free visits to your blog. If you are not already a member of BlogExplosion, join it now, then write a post in your blog with 3 active links to any of the blogs below (homepage or individual post page, ie., permalink). When you are done, comment in this post giving the link to the post and your BlogExplosion user-name, and I will transfer 100 credits (which means 100 visits) to your BlogExplosion account if your blog PageRank is 1 and above, and 50 credits if your blog PageRank is 0. You can write anything. You can praise them, just describe them, or even criticise them. However, the post must be a permanent post, and not deleted after you get your free credits.

Wednesday, April 25, 2007

Sun-Earth Relationship

The Sun is our nearest star. Nuclear reactions deep inside the Sun create the light and heat we need for our survival. Scientists think the Sun was born about five billion years ago. Although the Sun is consuming four million tonnes of hydrogen fuel every second, it is so large that it should continue to shine for another five billion years. By that time, it will have swollen into a red giant, causing the oceans to boil away and destroying all life on our planet.

The Sun's activity varies over an 11-year period. The number of sunspots and flares, and the radiation output, change over time. The most recent peak in its cycle of activity occurred in mid-2000 with a second peak at the end of 2001. Scientists are hoping that the two missions in ESA's Solar-Terrestrial Programme, SOHO and Cluster, will be able to tell them more about how the Sun works and how it affects the Earth. While SOHO studies explosions on the Sun and detects solar storms heading our way, Cluster will measure the effects of this activity on near-Earth space as the incoming energetic particles subject the magnetosphere to a buffeting.


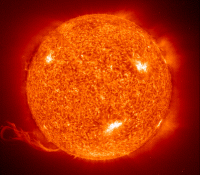
The Sun as seen by SOHO on 14 September 1997 in extreme ultraviolet light.
The solar prominence, bottom left, has a temperature of some 70 000 °C.
The solar corona is hotter than a million degrees Celsius


Facts about the Sun


Distance From Earth

149 600 000 km

Diameter

1 392 000 km (= 109 Earth diameters)

Rotation Period at Equator

24.6 days

Surface Temperature

5500 oC

Core Temperature

15 million oC

Mass (Earth = 1)

333 000

Volume (Earth = 1)

1 300 000

Gravity (Earth = 1)

27.94


How the Sun affects our planet

The Sun affects our world in many ways. A continuous stream of atomic particles - the solar wind - pours out into space from the Sun at speeds ranging from 300 to 1000 kilometres per second (1800 times faster than Concorde!). Sometimes, explosions on the Sun send millions of tonnes of gas towards the Earth. These clouds of high energy particles can cross the 150 million kilometre gulf between the Sun and Earth in a few days. The most energetic particles of all, created by solar flares, can reach Earth in just 30 minutes.

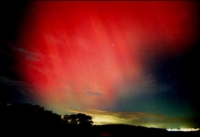
An aurora: a product of charged particles radiated by the Sun interacting with the Earth's atmosphere

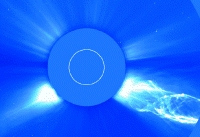
A solar Coronal Mass Ejection (CME) event as recorded by SOHO on 2 June 1998

When charged particles from the Sun enter Earth's upper atmosphere, they create shimmering curtains of coloured light, known as auroras, in the polar night sky. Other effects can be much more serious:
  • Solar storms affect Earth's ionosphere, causing disruption of short wave radio communications, navigation systems on ships and aircraft, and military radar systems
  • Surges in long electricity transmission lines may cause power and widespread blackouts, as happened in Quebec, Canada, in March 1989 when 6 million people were left without electricity due to a huge solar-induced magnetic storm
  • Damage to microchips and electrical discharges may cause satellites to stop operating, causing disruption of, for example, telephone, TV and data communication services
  • Radiation levels can become hazardous to astronauts and occupants of high flying aircraft
  • High energy particles hitting Earth's upper atmosphere can destroy the ozone layer, which protects us from harmful ultraviolet radiation
  • Solar storms have even been blamed for increased corrosion in oil pipelines
  • Solar energy output varies over the 11-year sunspot cycle. This may cause climate changes, which can affect vegetation growth and food supplies
source : http://sci.esa.int

Eye Classes of Photosensors

Where do the properties of the eye get involved?

It's know that the eye does not see all wavelengths equally. The eye has two general classes of photosensors, cones and rods.

Cones:
The cones are responsible for light-adapted vision; they respond to color and have high resolution in the central foveal region. The light-adapted relative spectral response of the eye is called the spectral luminous efficiency function for photopic vision, V(l) or V(wavelength). This empirical curve, first adopted by the International Commission on Illumination (CIE) in 1924, has a peak of unity at 555 nm, and decreases to levels below 10–5 at about 370 and 785 nm. The 50% points are near 510 nm and 610 nm, indicating that the curve is slightly skewed. The V(l) curve looks very much like a Gaussian function; in fact a Gaussian curve can easily be fit and is a good representation under some circumstances. I used a non-linear regression technique to obtain the following equation:

Vlambda.gif (557 bytes)

More recent measurements have shown that the 1924 curve may not best represent typical human vision. It appears to underestimate the response at wavelengths shorter than 460 nm. Judd (1951), Vos (1978) and Stockman and Sharpe (1999) have made incremental advances in our knowledge of the photopic response.

Rods:
The rods are responsible for dark-adapted vision, with no color information and poor resolution when compared to the foveal cones. The dark-adapted relative spectral response of the eye is called the spectral luminous efficiency function for scotopic vision, V’(l). This is another empirical curve, adopted by the CIE in 1951. It is defined between 380 nm and 780 nm. The V’(l) curve has a peak of unity at 507 nm, and decreases to levels below 10–3 at about 380 and 645 nm. The 50% points are near 455 nm and 550 nm. This scotopic curve can also be fit with a Gaussian, although the fit is not quite as good as the photopic curve. My best fit is

Vlambda'.gif (577 bytes)

Photopic (light adapted cone) vision is active for luminances greater than 3 cd/m2. Scotopic (dark-adapted rod) vision is active for luminances lower than 0.01 cd/m2. In between, both rods and cones contribute in varying amounts, and in this range the vision is called mesopic. There are currently efforts under way to characterize the composite spectral response in the mesopic range for vision research at intermediate luminance levels.

The Color Vision Lab at UCSD has an impressive collection of the data files, including V(l), V’(l), and some of the newer ones that you need to do this kind of work.

Difference of lambertian and isotropic

What is the difference between lambertian and isotropic?

Both terms mean "the same in all directions" and are unfortunately sometimes used interchangeably.

Isotropic implies a spherical source that radiates the same in all directions, i.e., the intensity (W/sr) is the same in all directions. We often hear about an "isotropic point source." There can be no such thing; because the energy density would have to be infinite. But a small, uniform sphere comes very close. The best example is a globular tungsten lamp with a milky white diffuse envelope, as used in dressing room lighting. From our vantage point, a distant star can be considered an isotropic point source.

Lambertian refers to a flat radiating surface. It can be an active surface or a passive, reflective surface. Here the intensity falls off as the cosine of the observation angle with respect to the surface normal (Lambert's law). The radiance (W/m2-sr) is independent of direction. A good example is a surface painted with a good "matte" or "flat" white paint. If it is uniformly illuminated, like from the sun, it appears equally bright from whatever direction you view it. Note that the flat radiating surface can be an elemental area of a curved surface.

The ratio of the radiant exitance (W/m2) to the radiance (W/m2-sr) of a lambertian surface is a factor of p or (pi) and not 2p or 2pi . We integrate radiance over a hemisphere, and find that the presence of the factor of cos(q) or (cos teta) in the definition of radiance gives us this interesting result. It is not intuitive, as we know that there are 2p steradians in a hemisphere.

A lambertian sphere illuminated by a distant point source will display a radiance which is maximum at the surface where the local normal coincides with the incoming beam. The radiance will fall off with a cosine dependence to zero at the terminator. If the intensity (integrated radiance over area) is unity when viewing from the source, then the intensity when viewing from the side is 1/p . Think about this and consider whether or not our Moon is lambertian. I'll have more to say about this at a later date in another place!


Quantities and units used in photometry

They are basically the same as the radiometric units except that they are weighted for the spectral response of the human eye and have funny names. A few additional units have been introduced to deal with the amount of light reflected from diffuse (matte) surfaces. The symbols used are identical to those radiometric units, except that a subscript "v" is added to denote "visual". The following chart compares them.
QUANTITY
RADIOMETRIC
PHOTOMETRIC
powerwatt (W)
lumen (lm)
power per unit areaW/m2lm/m2 = lux (lx)
power per unit solid angleW/srlm/sr = candela (cd)
power per area per solid angleW/m2-srlm/m2-sr = cd/m2 = nit

Now we can get more specific about the details.

The candela is one of the seven base units of the SI system. It is defined as follows:

The candela is the luminous intensity, in a given direction, of a source that emits monochromatic radiation of frequency 540 x 1012 hertz and that has a radiant intensity in that direction of 1/683 watt per steradian.

The candela is abbreviated as cd and its symbol is Iv. The above definition was adopted by the 16th CGPM in 1979.

The candela was formerly defined as the luminous intensity, in the perpendicular direction, of a surface of 1/600 000 square metre of a black body at the temperature of freezing platinum under a pressure of 101 325 newtons per square metre. This earlier definition was initially adopted in 1946 and later modified by the 13th CGPM (1967). It was abrogated in 1979 and replaced by the current definition.

The current definition was adopted because of several reasons. First, the freezing point of platinum (» 2042K) was tied to another base unit, the kelvin. If the best estimate of this point were changed, it would then impact the candela. The uncertainty of the thermodynamic temperature of this fixed point created an unacceptable uncertainty in the value of the candela. Second, the realization of the Pt blackbody was extraordinarily difficult; only a few were ever built. Third, if the temperature were slightly off, possibly because of temperature gradients or contamination, the freezing point might change or the temperature of the cavity might differ. The sensitivity of the candela to a slight change in temperature is significant. At a wavelength 555 nm, a change in temperature of only 1K results in a luminance change approaching 1%. Fourth, the relative spectral radiance of blackbody radiation changes drastically (some three orders of magnitude) over the visible range. Finally, recent advances in radiometry offered a host of new possibilities for the realization of the candela.

The value 683 lm/W was selected based upon the best measurements with existing platinum freezing point blackbodies. It has varied over time from 620 to nearly 700 lm/W, depending largely upon the assigned value of the freezing point of platinum.   The value of 1/600 000 square metre was chosen to maintain consistency with prior standards. Note that neither the old nor the new definition say anything about the spectral response of the human eye. There are additional definitions that include the characteristics of the eye, but the base unit (candela) and those SI units derived from it are "eyeless."

Also note that in the definition there is no specification for the spatial distribution of intensity. Luminous intensity, while often associated with an isotropic point source, is a valid specification for characterizing highly directional light sources such as spotlights and LEDs.

One other issue before we press on. Since the candela is now defined in terms of other SI derived quantities, there is really no need to retain it as an SI base quantity. It remains so for reasons of history and continuity.


The lumen is an SI derived unit for luminous flux. The abbreviation is lm and the symbol is Fv. The lumen is derived from the candela and is the luminous flux emitted into unit solid angle (1 sr) by an isotropic point source having a luminous intensity of 1 candela.   The lumen is the product of luminous intensity and solid angle, cd-sr. It is analogous to the unit of radiant flux (watt), differing only in the eye response weighting. If a light source is isotropic, the relationship between lumens and candelas is 1 cd = 4p lm. In other words, an isotropic source having a luminous intensity of 1 candela emits 4p lumens into space, which just happens to be 4p steradians. We can also state that 1 cd = 1 lm/sr, analogous to the equivalent radiometric definition.

If a source is not isotropic, the relationship between candelas and lumens is empirical. A fundamental method used to determine the total flux (lumens) is to measure Later on, we can use this "calibrated" lamp as a reference in an integrating sphere for routine measurements of luminous flux.

Lumens are what we get from the hardware store when we purchase a light bulb. We want a high number of lumens with a minimum of power consumption and a reasonable lifetime. Projection devices are also characterized by lumens to indicate how much luminous flux they can deliver to a screen.

Illuminance is another SI derived quantity which denotes luminous flux density . It has a special name, lux, and is lumens per square metre, or lm/m2. The symbol is Ev. Most light meters measure this quantity, as it is of great importance in illuminating engineering. The IESNA Lighting Handbook has some sixteen pages of recommended illuminances for various activities and locales, ranging from morgues to museums. Typical values range from 100 000 lx for direct sunlight to 20-50 lx for hospital corridors at night. Luminance should probably be included on the official list of derived SI quantities, but is not. It is analogous to radiance, differentiating the lumen with respect to both area and direction. It also has a special name, nit, and is cd/m2 or lm/m2-sr if you prefer. The symbol is Lv.  It is most often used to characterize the "brightness" of flat emitting or reflecting surfaces.  A typical use would be the luminance of your laptop computer screen.  They have between 100 and 250 nits, and the sunlight readable ones have more than 1000 nits. Typical CRT monitors have between 50 and 125 nits.


Other photometric units

We have other photometric units (boy, do we have some strange ones). Photometric quantities should be reported in SI units as given above. However, the literature is filled with now obsolete terminology and we must be able to interpret it. So here are a few terms that have been used in the past.


Illuminance :

1 metre-candle = 1 lux

1 phot = 1 lm/cm2 = 104 lux

1 foot-candle = 1 lumen/ft2 = 10.76 lux

1 milliphot = 10 lux


Luminance : Here we have two classes of units. The first is conventional, easily related to the SI unit, the cd/m2 (nit).

1 stilb = 1 cd/cm2 = 104 cd/m2 = 104 nit

1 cd/ft2 = 10.76 cd/m2 = 10.76 nit


The second class was designed to "simplify" characterization of light reflected from diffuse surfaces by including in the definitions the concept of a perfect diffuse reflector (lambertian, reflectance r = 1). If one unit of illuminance falls upon this hypothetical reflector, then 1 unit of luminance is reflected. The perfect diffuse reflector emits 1/p units of luminance per unit illuminance. If the reflectance is r, then the luminance is r times the illuminance. Consequently, these units all have a factor of (1/p) built in.

1 lambert = (1/p) cd/cm2 = (104/p) cd/m2

1 apostilb = (1/p) cd/m2

1 foot-lambert = (1/p) cd/ft2 = 3.426 cd/m2

1 millilambert = (10/p) cd/m2

1 skot = 1 milliblondel = (10-3/p) cd/m2


Photometric quantities are already the result of an integration over wavelength. It therefore makes no sense to speak of spectral luminance or the like.

Quantities and Units in Radiometry

What are the quantities and units used in radiometry?

Radiometric units can be divided into two conceptual areas: those having to do with power or energy, and those that are geometric in nature. The first two are:

Energy is an SI derived unit, measured in joules (J). The recommended symbol for energy is Q. An acceptable alternate is W.

Power (a.k.a. radiant flux) is another SI derived unit. It is the derivative of energy with respect to time, dQ/dt, and the unit is the watt (W). The recommended symbol for power is F (the uppercase Greek letter phi). An acceptable alternate is P.

Energy is the integral over time of power, and is used for integrating detectors and pulsed sources. Power is used for non-integrating detectors and continuous sources. Even though we patronize the power utility, what we are actually buying is energy in watt-hours.

Now we become more specific and incorporate power with the geometric quantities area and solid angle

Irradiance (a.k.a. flux density) is another SI derived unit and is measured in W/m2. Irradiance is power per unit area incident from all directions in a hemisphere onto a surface that coincides with the base of that hemisphere. A similar quantity is radiant exitance, which is power per unit area leaving a surface into a hemisphere whose base is that surface. The symbol for irradiance is E and the symbol for radiant exitance is M. Irradiance (or radiant exitance) is the derivative of power with respect to area, dF /dA. The integral of irradiance or radiant exitance over area is power.

Radiant intensity is another SI derived unit and is measured in W/sr. Intensity is power per unit solid angle. The symbol is I. Intensity is the derivative of power with respect to solid angle, dF /dw . The integral of radiant intensity over solid angle is power.

Radiance is the last SI derived unit we need and is measured in W/m2-sr. Radiance is power per unit projected area per unit solid angle. The symbol is L. Radiance is the derivative of power with respect to solid angle and projected area, dF /dw dA cos(q) where q is the angle between the surface normal and the specified direction. The integral of radiance over area and solid angle is power.

A great deal of confusion concerns the use and misuse of the term intensity. Some folks use it for W/sr, some use it for W/m2 and others use it for W/m2-sr. It is quite clearly defined in the SI system, in the definition of the base unit of luminous intensity, the candela. Some attempt to justify alternate uses by adding adjectives like field or optical (used for W/m2) or specific (used for W/m2-sr), but this practice only adds to the confusion. The underlying concept is (quantity per unit solid angle). For an extended discussion, I wrote a paper entitled "Getting Intense on Intensity" for Metrologia (official journal of the BIPM) and a letter to OSA's "Optics and Photonics News". A modified version is available on the web.

Photon quantities are also common. They are related to the radiometric quantities by the relationship Qp = hc/l where Qp is the energy of a photon at wavelength l , h is Planck's constant and c is the velocity of light. At a wavelength of 1 mm, there are approximately 5×10¹⁸ photons per second in a watt. Conversely, also at 1 mm, 1 photon has an energy of 2×10–19 joules (watt-sec). Common units include sec–1-m–2-sr–1 for photon radiance.

Projected area and solid angle

What is projected area?

Projected area is defined as the rectilinear projection of a surface of any shape onto a plane normal to the unit vector. The differential form is dAproj = cos(b) dA where b is the angle between the local surface normal and the line of sight. We can integrate over the (perceptible) surface area to get

wpe1.jpg (1407 bytes)


Some common examples are shown in the table below:


SHAPEAREAPROJECTED AREA
Flat rectangleA = L×WAproj= L×W cos b
Circular discA = p r2

    = p d2 / 4
Aproj = p r2
cos b

         = p d2
cos b / 4
SphereA = 4 p r2 = p
d2
Aproj = A/4 = p r2


What is solid angle?

Plane angle and solid angle are two derived units in the SI system. The following definitions are taken from NIST SP811.

"The radian is the plane angle between two radii of a circle that cuts off on the circumference an arc equal in length to the radius."

The abbreviation for the radian is rad. Since there are 2p radians in a circle, the conversion between degrees and radians is 1 rad = (180/p) degrees.

A solid angle extends the concept to three dimensions.
"One steradian (sr) is the solid angle that, having its vertex in the center of a sphere, cuts off an area on the surface of the sphere equal to that of a square with sides of length equal to the radius of the sphere."

The solid angle is thus ratio of the spherical area to the square of the radius. The spherical area is a projection of the object of interest onto a unit sphere, and the solid angle is the surface area of that projection. If we divide the surface area of a sphere by the square of its radius, we find that there are 4p steradians of solid angle in a sphere. One hemisphere has 2p steradians.

The symbol for solid angle is either w , the lowercase Greek letter omega, or W , the uppercase omega. I use w exclusively for solid angle, reserving W for the advanced concept of projected solid angle (w cosq ).

Both plane angles and solid angles are dimensionless quantities, and they can lead to confusion when attempting dimensional analysis.

Radiometry and photometry

What is radiometry ? 

Radiometry is the measurement of optical radiation, which is electromagnetic radiation within the frequency range between 3×10¹¹ and 3×10¹⁶ Hz. This range corresponds to wavelengths between 0.01 and 1000 micrometres (m m), and includes the regions commonly called the ultraviolet, the visible and the infrared. Two out of many typical units encountered are watts/m2 and photons/sec-steradian.

What is photometry ?

Photometry is the measurement of light, which is defined as electromagnetic radiation which is detectable by the human eye. It is thus restricted to the wavelength range from about 360 to 830 nanometers (nm; 1000 nm = 1 mm). Photometry is just like radiometry except that everything is weighted by the spectral response of the eye. Visual photometry uses the eye as a comparison detector, while physical photometry uses either optical radiation detectors constructed to mimic the spectral response of the eye, or spectroradiometry coupled with appropriate calculations to do the eye response weighting. Typical photometric units include lumens, lux, candelas, and a host of other bizarre ones.

How do Radiometry and photometry differ

The only real difference between radiometry and photometry is that radiometry includes the entire optical radiation spectrum, while photometry is limited to the visible spectrum as defined by the response of the eye. In my forty years of experience, photometry is more difficult to understand, primarily because of the arcane terminology, but is fairly easy to do, because of the limited wavelength range. Radiometry, on the other hand, is conceptually somewhat simpler, but is far more difficult to actually do.


Tuesday, April 24, 2007

Blog-Post Template

What is a Blog-post template?

Post templates help users save time by pre-formatting the post editor. Some users like their posts to be formatted in a certain way; here's an example where the user links to an article on the first line, then quotes it below:

AdWords cost

How much does AdWords cost?

Use the Account Fees and Payment Options Finder to find out about AdWords costs and payment options. After you select your currency and location, we'll show you exactly what spending requirements you can expect from us (there's not many) and which payment options you'll have. You'll see that you can pretty much spend as much or as little as you like.

Here are a few basic things to consider when trying to assess the cost of your AdWords campaign.

Set your budget
• There's no minimum spending requirement--just a nominal, one-time activation fee.
• You set the limit on how much you're willing to spend each day.
• You specify how much you're willing to pay per click or per impression.

Pay only for results
• You pay only for clicks on your keyword-targeted AdWords ads.
• You pay only for impressions on your site-targeted AdWords ads.

Avoid the guesswork
• Use the Keyword Tool to explore keyword traffic and cost estimates and make informed decisions about choosing keywords and maximizing your budget.

After you set the framework for costs and get your campaign started, you know you'll stick within your budget. From there, you can access your account at any time to adjust ad text, keywords, campaign settings, cost-per-click (CPC) bids, and daily budget to make sure you get the most bang for your buck

Monday, April 23, 2007

Gorontalo Residental

Gorontalo Residental
by Rantje

Gorontalo is the newest province on Sulawesi. Recently separated from North Sulawesi, it covers a mere 12,000 sq. km. with a population of 840,000. The area is composed of extensive coastlines, rugged mountains, and a large central valley almost entirely surrounded by steep slopes. At its center is beautiful Lake Limboto. Because of its narrowness, those flying into the new Jalaluddin Airport can view both northern and southern coastlines simultaneously. According to local legend, Gorontalo appeared when the seas subsided, leaving a wide land area with three mountains in the middle.


This legend is plausible given the presence of high limestone cliffs along the southern coastline where ancient corals and giant shells are clearly evident in the cliffs. Scuba diving along this coastline is spectacular. Before the arrival of foreign influences, Gorontalo was organized into a federation of five kingdoms. This federation had a representative assembly to choose the king and then to advise him. Succession was not hereditary but based on the worthiness of the candidate and popular sentiment. A bad king could be - and was - removed by vote. Queens also came to power. This system had been functioning since the 14th century.


Islam arrived with the growing regional influence of the Ternate Sultanate during the mid 16th century. A descendant of a Gorontalo king was married to Baabullah, the Sultan of Ternate. When she was kidnapped on the waters of Tomini Bay, the family naturally sent word to the Sultan. The help he sent marks the entrance of Islam into Gorontalo’s ruling elite. This arrival of Islam in 1566 occurred during the middle of a bitter 200-year long civil war. In 1525, three small rock forts were built overlooking the waters of Lake Limboto with Portuguese assistance. Still in place today, the Fort Otonaha complex provides wonderful views.


The Spanish also entered the general area in limited numbers via the Philippines during the mid-1500s. They introduced corn, tomatoes, chili peppers, horses, and the afternoon siesta to Gorontalo, all of which are an integral part life today.


The Dutch under the aegis of the United East India Company (VOC) worked to wrest control of the lucrative spice trade away from the Sultanate of Ternate and push out all other European competitors. Since the Sultan of Ternate had just brokered a peace treaty that ended Gorontalo’s protracted civil war, he was able to surrender control of Gorontalo to the Dutch. That year (1677) the Dutch governor of Maluku visited Gorontalo, making preparations for a contract between the Gorontalo federation of kingdoms and the VOC. This contract gave the VOC control over the Gorontalo plus the entire Tomini Bay. Gradually, the Dutch gained political control of Gorontalo and ended both the federation and the power of the kings.

The Japanese occupied Gorontalo during the war. The Gorontalese are proud of their resistance. Local hero Nani Wartabone led the struggle and the Japanese were forced out as of 23 January 1942. Locals proudly point out that the Indonesian flag first flew here, a full three years prior to Indonesian independence from the Dutch in 1945. Since Gorontalo escaped Allied bombing during the war, a number of Dutch-era buildings are still standing. Although many are in poor repair, Gorontalo City has a distinctive colonial appearance.

Located just north of the equator, Gorontalo City charms visitors with its architecture and shade trees, streets bustling with horse-drawn buggies and motorized rickshaws, and friendly residents. Those shouts of "Hello, mister!" mean that people are really pleased to see you. In addition to the Fort Otonaha complex overlooking Lake Limboto, other areas of interest include Lombongo Hot Springs and an easy jungle trek to a waterfall in Nani Wartabone National Park (formerly Dumoga-Bone). Although Gorontalo City is often a transit point for those going to the Togian (Togean) islands, diving is seasonally available from the City. Miguel’s Diving, located in the Hotel Melati Cyber Café, takes certified divers to the dramatic cliffs of Gorontalo.


Google SketchUp - A powerful 3D software tool

Google SketchUp - A powerful 3D software tool

Developed for the conceptual stages of design, Google SketchUp is a powerful yet easy-to-learn 3D software tool that combines a simple, yet robust tool-set with an intelligent drawing system that streamlines and simplifies 3D design. From simple to complex, conceptual to realistic, Google SketchUp enables you to build and modify 3D models quickly and easily. If you use Google Earth, Google SketchUp allows you to place your models using real-world coordinates and share them with the world using the Google 3D Warehouse.


SketchUp Advantages :

  • Simple: Learn the small toolset quickly
  • Fast: Model as fast as you think
  • Powerful: Design anything from a shoebox to a skyscraper
  • Flexible: Make your models loose/conceptual or tight/accurate
  • Fun: Place your models in Google Earth

Two versions of Google SketchUp :

1.  Google SketchUp 6 (Free version)
Google SketchUp 6 is a 3D modeling software tool that’s easy to learn, simple to use, and lets you place your models in Google Earth. Are you remodeling a kitchen, landscaping your back yard or adding a deck to your home? Google SketchUp makes it faster, easier and a lot more fun. From simple to complex, from conceptual to realistic, Google SketchUp helps you see your vision before you build it.

Once you've built your models, you can place them in Google Earth, post them to the 3D Warehouse.


Download
Google SketchUp 6 (Free version) below link :

Windows 2000/XP(31.8 MB)             Mac OS X 10.3.9(44.9 MB)
Note: choose according to your OS

2. Google SketchUp Pro 6 ($495)
Google SketchUp Pro 6 is a 3D modeling software tool that allows designers and planners to explore, communicate and present complex 3D concepts. Its import/export capability gives you the speed and functionality for use in a professional workflow. And now, with SketchUp Pro 6's LayOut (beta) feature, you can integrate 3D models with 2D elements to create compelling interactive presentations. LayOut (beta) also enables you to output large-format, high-resolution documents.

DOWNLOAD
Google SketchUp Pro 6 (Trial)


Note : To download an 8 hour trial of Google SketchUp Pro 6
You need fill out form to get the fully functioning application.

Strategic Plan for Web Design

There are millions of web sites on the Internet today with thousands more being added each day. The competition is fierce and in order to be successful, you must stay one step ahead of the game.

Although designing a professional web site is an important part of your strategic plan, it is only the first step. Before you begin the actual design process, you must first determine your overall strategy and design your web site accordingly.

Internet marketers have basically two choices:

-> Design a mini web site that focuses on just one product or service, with no other content of any kind.

-> Design a content web site that includes not only your products and services, but also information and resources that will be of interest to your target market.

Although both types of sites can be effective, your success ultimately depends on your site design and marketing strategies. Both will play a very important role.


Content Web Sites
Content oriented sites are sites that provide visitors with content, such as articles, tutorials, free ebooks and resources. This type of site attracts their target audience with incentives. Their products and services are mentioned on the main page with a link to further information.

Content sites usually profit by educating their visitors. For example, a content site focusing on dog grooming might provide a basic tutorial to assist their visitors in learning how to groom a dog. They provide this tutorial completely free; however, the main purpose for this tutorial is to educate their visitors and promote their products.

When you provide your visitors with quality information that teaches and informs, you are not only gaining their trust in you by sharing your expertise, but you're also building your credibility, which is very important on the Internet.

The key to using this technique effectively is to provide content that targets your potential customer.


Mini-Sites
Mini-sites are different from content sites, as they don't provide any content. They usually contain one or two pages and completely focus on one product or service. Basically, the site is just a sales letter for the product.

No matter which type of site you design, keep in mind, your web site is a direct reflection of you and your business. The appearance of your web site is the most important factor in determining your web site's value. If your site doesn't look professional or pleasing to the eyes at first glance, it's perceived value will be low. The perceived value of your web site will have a great impact on your success.

On the other hand, you may have a great web site, well designed and a quality product or service, but if it takes too long to load, the value will still be perceived as low. Why? Your potential customer will not wait -- ultimately costing you business.

If you're serious about your Internet business, designing a web site specifically designed to sell your products is an essential part of your success. Everything within your web site should have one specific purpose -- getting your visitors to take action.


Prior Strategy to designing your web site
Prior to designing your web site, you must decide on the type of response you're looking for. For example, if you're selling a product, the response you're most-likely trying to achieve is to make a sale. If you're developing a content site, your main goal for every page of your site should be to lead your visitors to your sales page. You can accomplish this in a number of ways, including:

  1. Display a graphic image of your product on your main page with a short ad and a link leading to your sales page.
  2. Create a "Products" section within the navigational menu of each page with a short description and link to each of your products.
  3. Write articles that focus on the same topic as your product. At the end of the article, within your bylines, provide your visitors with information about your product.
  4. Write tutorials that target your potential customer. At the end of the tutorial, provide information about your product.
  5. Provide your visitors with a free autoresponder course. Your course should identify a problem, provide advice in regard to solving the problem and provide the solution with your products or services. Keep in mind, your course should not be written like a sales letter. It must provide quality information written to teach and inform.

No matter what type of response you're looking for, your site must be specifically designed to achieve your goal.

Every part of your web site must be strategically designed. From your overall design to your sales copy -- each will play a very important role.

Your web site is the most important sales tool you have. A professional web site should be pleasing to the eyes, well organized, easy to navigate, load quickly and be optimized for the Search Engines.

Above all else, you must specifically design your site for your potential customers. Provide them with the information they desire, while continually mentioning the benefits of your products, and you'll reap the rewards.

OTHER WAY TO POST PICTURE IN A BLOG

OTHER WAY TO POST PICTURE IN A BLOG .


Aside from the image uploading tool built into Blogger's post editor, there are several other options to help you get pictures on your blog. Here's the list:

  1. If you have a camera phone or a similar mobile device, you can use Blogger Mobile to send photos to your blog. The attached images will be uploaded to the web and included in your post (similar to the way Hello Bloggerbot below works).
  1. Windows users can download Google's free photo software, Picasa, and use the "BlogThis!" button to post pictures directly to their blogs. One advantage in using this method is that any edits you make in Picasa, like removing red-eye or lighting enhancements, are uploaded along with your photo. Captions written in Picasa are not transferred in this release, so you will need to add these in the Blogger post editor.

See: Picasa Support for more information.
Another option to try is the Hello BloggerBot (also from the folks who created Picasa). We have an article on photoblogging, which explains in further detail how Hello works. It also discusses some neat Hello features, such as customized Blogger/photo preferences

  1. There are a number of third-party services that will let you post pictures to your blog, including http://flickr.com/, BuzzNet, FotoFlix, Photobucket, and Photolightnin
  2. If you already have images stored on your own server (or elsewhere on the web), you can include them in your posts via the standard img tag: 
Example

Remote Sensing and GIS Use in Coral Reef Management

Remote Sensing and GIS Use in Coral Reef Management

Mochamad Putrawidjaja

Remote Sensing (RS) and Geographic Information System (GIS) have been using in assessing coral reefs for decades by research and academic institutions as well as in managing the resources by the governments. Designed earlier as land-based mapping application, remote sensing and GIS have been applied in coral reef mapping twenty years ago, addressing the requirement of remotely sensed monitoring of extremely wide coral reef area. However, many constraints occurred in its development in marine sector. In this paper, I will describe technical, institutional, data availability and other constraints in developing remote sensing and GIS in marine field, particularly in Indonesia, the country that has the widest coral reef region and the most diverse in marine biodiversity.

Initially, technical constraint in applying remote sensing and GIS in the sea is its capacity to scan the seafloor through certain depth where coral reef lives. Seawater properties, such as salinity and temperature, is potentially scattered or dispersed the electromagnetic wave transmitted by the satellite (Winarso and Budhiman, 2000). Besides, it is difficult to interpret and distinguish a wide array of underwater features from satellite images. Reef flat may be seen identical in several places but appear with distinguished spectrum in satellite image because of different depth and opacities.

Eventually, many researches have been conducted to address that constraint. For instance, CASI (compact airborne spectrographic imager) method that can reach 15 meters depth (Mumby 1998 and Minghelli-Roman et. al. 2000). Moreover, other application of Landsat 7-ETM+, SPOT HRV, SeaWiFS LAC, space shuttle photography and HDTV were able to determine the reef slope and up to 7 classes simple habitat characteristic (Andréfouët et. al. 2000). In contrast, reef biologists have not yet agreed in defining the term “reef” as well as standardizing the classification scheme of the variety reef habitat type.

Vast needs in monitoring the reef health motivate the development of the system that can identify and determine the type seafloor substrate. Australia initiated the effort since they started to protect the Great Barrier Reef from natural and anthropogenic threats. CSIRO (Commonwealth Scientific, Industrial and Research Organization) and AIMS (Australian Institute of Marine Science) intensively observed the health of the Great Barrier Reef using many techniques, such as spectral measurement of radiometric reflectance (Skirving et. al. 2000). Coral bleaching events in the Indo-Pacific region, both as a result of El Ninõ events (1982-83 and 1997-98) and crown-of-thorn starfish grazing accelerates the development. Later, the United States developed higher technology into the system. NASA and USGS developed a cost-effective instrument for investigating high diversity and species rich reefs, the Experimental Advanced Airborne Research LIDAR/EAARL (Brock et. al. 2000). Furthermore, USGS also applied digitized aerial photographs and airborne digital SHOALS (Scanning Hydrographic Operational Airborne LIDAR Survey) laser bathymetry data to locate features on the reef, define the local geomorphology, and as a geographic base to plot results.

Although studying coral reefs was more likely discussing its spatial intactness and competition among its inhabitant, remote sensing and GIS were mostly used to estimate area coverage. Many researches focused more on how to get the finest resolution to map coral reefs, instead of how to define the reef itself. In addition, since most of remote sensing and GIS applications were previously designed to map land-based features, such as Landsat TM satellite images, they can clearly define the building beneath 2-m tree canopy but they could not determine the seabed substrate type below 20 m depth. In fact, observing coral reefs below sea level was not as easy as observing land-based features.

Another technical constraint is how to distinguish the type of seafloor substrate. CASI (compact airborne spectrographic imager), which can reach below 15 meters depth, was unable to determine whether the shelf features shown on the image was coral, sand or any other substrate. Minghelli-Roman et. al. (2000) suggested to combine CASI with ground-level spectra and photographic records to obtain spectral reflectance images of a species rich coral reef. Other data produce by Landsat 7-ETM+, SPOT HRV, SeaWiFS LAC, space shuttle photography and HDTV, which can determine the reef slope and simple habitat characteristic, were unable to determine the coral species (Andréfouët et. al. 2000).

Remote sensing and GIS were more applied as mapping tool instead of management tool in developing countries, particularly in this paper is Indonesia. Intensive use of remote sensing and GIS in Indonesia initiated in the World Bank-funded Land Resource Evaluation and Planning project (LREP) conducted by the Indonesia’s National Land Agency (BPN) in early 1980s. Later on, BPN and the Indonesian Institute of Science (LIPI) attempted to apply such system to marine sector through the Marine Resource Evaluation and Planning project (MREP), which seems to be persisted since they were using the similar software of previous LREP project. In the last ten years, LIPI is conducting the World Bank-loaned Coral Reef Mapping and Management Project (Coremap). In the last five years, more government bodies are also mapping Indonesian coral reefs, including the Indonesia’s National Aeronautics and Space Agency (LAPAN), National Coordination Body of Survey and Mapping (Bakosurtanal) and National Agency of Assessment and Application of Technology (BPPT). Apparently, those organizations performed more coral reefs mapping, instead of gathering related information to be inserted into the system. Most of them focused on introducing and assessing various technologies to map the reefs, instead of developing certain appropriate technique to manage the data.

On the other hand, human resource that can operate the system was not developed very well because lack of expertise and specialties. Many experts and specialists preferred to work in private sector, rather than teaching or doing the researches.

Data availability is another major constraint in developing remote sensing and GIS in coral reef management. Most of basic marine maps in Indonesia were developing upon the more-than-fifty-year-old Dutch’s navigation maps. Most of those maps did not update for years and also did not cover most of remote regions, where coral reefs are still relatively undisturbed and abundant. On the other hand, the satellite image price is very expensive.

Consequently, many coral reef management projects in developing countries attempt to combine the remote sensing and GIS with participatory community mapping. Such combination makes the coral reef mapping is easier to perform and the result can accommodate all stakeholders’ interest, like how the URI’s Coastal Resource Management Project (CRMP) performs in several locations in Indonesia.

That vast development of various techniques and methods to assess coral reefs, both on its coverage and its species richness, seems promising to address the requirements of cost-effective tools to manage the reefs. However, it does not comparable with the deployment cost. Since most of coral reefs are mostly located in economically weak developing and underdeveloped countries, cost of deploying such high technology, which is mostly cost in U.S. dollar, is still a big problem to be solved.

The above conditions made the remote sensing and GIS deployment was slower than its development, and put them either in experimental or conceptual format. Finally, many coral reef management projects in developing countries still preferred to put the community-based mapping as a basis of coral reefs management and put GIS only as presentation enhancement device.

Annotate Bibliography:

Andréfouët, S., J.A. Robinson, G.C. Feldman, F.E. Muller-Karger, C.M. Hu, B. Salvat. 2000. Comparison of space sensors for estimation of coral reef areas in South Pacific atolls. Dept. of Marine Science, University of South Florida. Saint Petersburg, Florida. Proc. 9th International Coral Reef Symp.: 233.
The authors describe variety of remote sensing data, including Landsat 7-ETM+, SPOT-HRV, SeaWiFS Local Area Coverage (LAC), Space Shuttle photography and High Definition Television (HDTV), collected over various atolls of the Tuamotu archipelago (French Polynesia). They found that SeaWIFS data were useful to estimate the atoll area, but cannot distinct between rim and lagoon because lack of sufficient spatial resolution to provide better than 80% accuracy. Space Shuttle HDTV images and photographs were useful for simple characterization of the rims (4 classes) and lagoon features, but could not accurately classify at more detailed levels. SPOT-HRV or LANDSAT/ETM+ were useful to classify the rim structure and simple habitat zones, but did not provide information on the steep outer or inner slopes.

Baxter, K. 2000. Assessing the extent of coral bleaching using aerial photography and image processing techniques, Great Barrier Reef, Australia. School Of Tropical Environment Studies and Geography, James Cook University, Townsville, Australia.

The author found that the management authorities difficult to monitor large-scale disturbances, primarily due to the extent and isolation of their jurisdictions. Remote sensing provides a potential means of cost effectively monitoring coral reefs across a variety of scales. In this paper, he applied remote sensing techniques to high-resolution aerial photographs of two Great Barrier Reef sites to detect coral reef bottom types and in particular, coral reef bleaching. He also applied a supervised remote sensing technique and unsupervised techniques to provide an efficient and accurate means of distinguishing more than 50% bleached corals at couple scales of observation. However, the result accuracy still required to be improved. Determining at which scale reef types are best classified may improve accuracy and ensure the overall health of the reef system is not misinterpreted.

Brock, J.C. and C.W. Wright. 2000. Preliminary results from a NASA Experimental Advanced Airborne Research LIDAR (EAARL) survey of Pacific Reef in Biscayne National Park, Florida. USGS Center For Coastal Geology, Florida. Proc. 9th International Coral Reef Symp.: 233

This paper describe the success of NASA and USGS to develop low-cost instrument to investigate high density and species rich coral reef, the Experimental Advanced Airborne Research LIDAR (EAARL), which couples a small field-of-view receiver with a high repetition rate (5000 Hz), low power, short-pulse laser. This airborne LIDAR remote sensing technique can acquire highly detailed bathymetry and bottom texture, and water depth for the correction of passive imagery, as well as stimulate and detect the fluorescence of coral heads; algae and other benthic cover types. This method was specifically designed for low cost coral reef investigation that require extremely high density bathymetry and hyperspectral scanning for useful benthic reef classification.

Bryant, D., L. Burke, J. McManus and M. Spalding. 1998. Reef at Risk: A Map-Based Indicator of Threat to the World’s Coral Reefs. Box: Tools and Techniques for Monitoring and Mapping Coral Reefs. World Resource Institute, International Center for Living Aquatic Resource Management, World Conservation Monitoring Centre and United Nations Environment Program. p: 40.

This book describes the use of geographic information on coral reefs around the world as a tool to indicate the threat. In one of the report’s boxes, the authors discuss that it is not necessary to deploy high technology or satellite-based method to monitor and map. A low-tech but user friendly community-based reef mapping is one of the most popular and widely consumed in managing coral reefs resources, particularly in less accessible and low infrastructure available region in developing countries. Although they provided an overview on the advantage and disadvantage of some techniques in obtaining coral reef map, the authors did not recommend any specific method.

Chavez P.S., Jr. and M. Field. 2000. Use of digitized aerial photographs and airborne laser bathymetry to map and monitor coral reefs. The United States Geological Survey. Proc. 9th International Coral Reef Symp.: 234.

This paper report that U. S. Geological Survey is using digitized aerial photographs and airborne digital SHOALS (Scanning Hydrographic Operational Airborne LIDAR Survey) laser bathymetry data to help map and study coral reef environments. Main advantage of this remotely sensed data is it is capable to locate features on the reef, define the local geomorphology, and as a geographic base to plot results. A promising application deals with temporal monitoring of change.

Ledrew, E.F.; M. Wulder and H. Holden. Change detection of satellite imagery for mapping and monitoring stressed corals. Department of Geography, University of Waterloo, Ontario, Canada. Proc. 9th International Coral Reefs Symp.: 236

This paper determines a procedure for change detection from the multidate SPOT data that is independent of spatial variations in water depth over the features of interest. The Getis statistic, which is based solely on image characteristics, is evaluated as a tool for change detection. Preliminary examination suggests that it meet the requirements for rapid assessment for environmental change without the need for individual image calibration based upon in situ information.

Minghelli-Roman, A., J.R. M. Chisholm, M. Marchioretti, H. Ripley & J.M. Jaubert. 2000. How good is CASI for Red Sea coral reef survey? Observatoire Océanologique Européen, Centre Scientifique de Monaco, Monaco. Proc. 9th International Coral Reef Symp.: 237

This paper describes the deployment of CASI (compact airborne spectrographic imager) system combined with ground-level spectra and photographic records to obtained spectral reflectance images of a species rich coral reef near Gübal Island, Red Sea. Comparison of CASI-derived thematic maps (by decomposing the pixel reflectance signatures) with photographed reef areas indicated that CASI has the potential to discern and map diverse reef communities to a depth of at least 15 m with good precision.

Mumby, P.J., E.P. Green, A.J. Edwards and C.D. Clark. 1997. Coral reef habitat mapping: how much detail can remote sensing provide? Marine Biology 130: 193-202

The authors studied the accuracy obtained by different imaging techniques and discusses its effectiveness and efficiency based upon cost per image. They found that Landsat TM was the most accurate and cost effective sensor to produce satellite imagery, but it was also less accurate, only 37 %. A 1:10,000 aerial photograph could provide the same detail as the satellite. On the other hand, CASI (compact airborne spectrographic imager) was the most consistently accurate sensor, about 89% in its accuracy. This article should consider to be reviewed by limited budgets institutions which willing to study coral reefs.

Mumby, P.J. E.P. Green, C.D. Clark and A.J. Edwards. 1998. Digital Analysis of multispectral airborne imagery of coral reefs. Coral Reefs 17: 69-69

In this article, authors discuss in detail the use of CASI (compact airborne spectrographic imager) to view 1-m pixels in 8 spectral bands. Reef images taken with CASI was compared to other satellite images produced by Landsat MSS, Landsat TM, SPOT XS, SPOT Pan and merged Landsat TM/SPOT Pan over Turks and Caicos Islands (British West Indies). Overall accuracy of CASI-derived habitat maps were 89% and 81% for coarse and fine levels of habitat discrimination, respectively. Accuracy was greatest once CASI data had been processed to compensate for variations in depth and edited to take account of generic patterns of reef distribution. These overall accuracy were significantly (P<0.001) better than those obtained from satellite imagery of the same site. In addition, this article was more likely a detail technical description of previous article.

Spalding, M.D. 1997. Mapping global reef distribution. Proc. 8th Coral Reef Symposium 2: 1555-1560.

World Conservation Monitoring Centre (WCMC) prepared a new estimation of global coral reef distribution by mapping emergent reef crest and very shallow reef systems. Data had been raster, using 1-km grid squares, as a means of reducing errors arising from variation in scale. Then, global and regional reef coverage was calculated from the resultant grid. They found difficult to create map since data was available in great different quality and scales, ranging from 1:250,000 to 1:1,000,000. However, the resulting map seems not much improved from previous maps.

Skirving, W., T. Kutser, J. Parslow, T. Done, M. Wakeford, I. Miller and L. Clementson. Remote sensing of coral reef health. Australian Institute of Marine Science, Townsville, Australia. Proc. 9th International Coral Reefs Symp.: 240

A joint project of CSIRO and AIMS tried to answer the question of the usefulness of remote sensing for mapping and monitoring the health of coral reefs. Unlike most previous projects, this project has taken a fresh approach to this problem. Instead of using any air- or space-borne data, the project used spectral measurements of radiometric reflectance to allow the development of models, which will help answer the main question of “how useful is remote sensing”, as well as help determine the form of the most suitable instrument. This paper described the techniques used to collect spectral information from the water column and benthic habitat in and around three Great Barrier Reef’s coral reefs. The reefs were chosen to represent a range of water quality. Along with the description of the instrumentation and techniques, some preliminary results were presented.

Winarso, G. and S. Budhiman. 2000. Application of remote sensing data for coral reef mapping in Indonesia. Indonesian Institute of Aeronautics and Space (LAPAN). Bogor, Indonesia

This paper examines the research result of the remote sensing application for coral reef mapping, the problems that occurred, the suggested method to solve the problem, the ability of remote sensing and the quality of the result. Landsat-TM data mainly used as primary data and SPOT multispectral data as comparison because of the availability of data in Indonesia. The author also describes their observation on Indonesia’s experience in implementing remote sensing data to assess coral reef, because it is the easiest and the cheapest. The problem occurred when the electromagnetic wave utilized to identify the coral either scattered or dispersed by the water mass, that made the techniques did not work well.


Recommended websites:

http://www.uncwil.edu/isrs International Society of Reef Studies

http://www.iclarm.org International Center for Living Aquatic Resource Management

http://www.reefcheck.org Reef Check International

http://www.wri.org World Resource Institute who published Reef at risk: a map-based indicator of threats to world coral reefs

http://www.wcmc.org World Conservation Monitoring Centre

http://www.ima-indo.org International Marinelife Alliance – Indonesia

http://www.wwf.or.id Worldwide Fund for Nature – Indonesia

http://www.tnc.or.id The Nature Conservancy - Indonesia

http://www.ci-ip.org Conservation International - Indonesia

http://www.crc.uri.edu URI Coastal Research Center

http://www.aims.edu.au, Australian Institute of Marine Science

http://www.csiro.com.au, Australian Commonwealth Scientific and Industrial Research Organization

http://www.gbrmpa.gov.au, Great Barrier Reef Management Authority

http://www.noaa.gov U.S. National Ocean and Atmosphere Administration

http://www.usgs.gov U.S. Geological Service

http://www.lipi.go.id, Indonesian Institute of Science

http://www.coremap.go.id, Indonesian Coastal Resource Management Project

http://www.bakosurtanal.go.id, Indonesian National Coordination Body of Survey and Mapping

http://www.nature.nl/~edcolijn/ Digital Map of Indonesia by Peter Loud